
Examples

    One lecture, run through the real thing. Nothing edited.

    We wrote a 15-slide first-year physiology lecture, uploaded it to production on 2026-09-03 with the level set to Medical, and asked for all three outputs. Everything below is what came back, including the parts we would edit.

    Source
    Oxygen Transport and Tissue Delivery, 15 slides, written in-house so it can be published
    Story
    55 s of model time, eight slides embedded
    Anki deck
    30 cards in 91 s, standard .apkg
    Practice set
    13 questions in 118 s, five flagged high-yield

    Timings are this one run on 2026-09-03 (model claude-opus-5); all three outputs were ready within about two minutes of upload. Your lecture will take its own time. These are study aids generated from a lecture, not NBME or NBOME items, and not for patient care.

    The source

    The lecture we uploaded

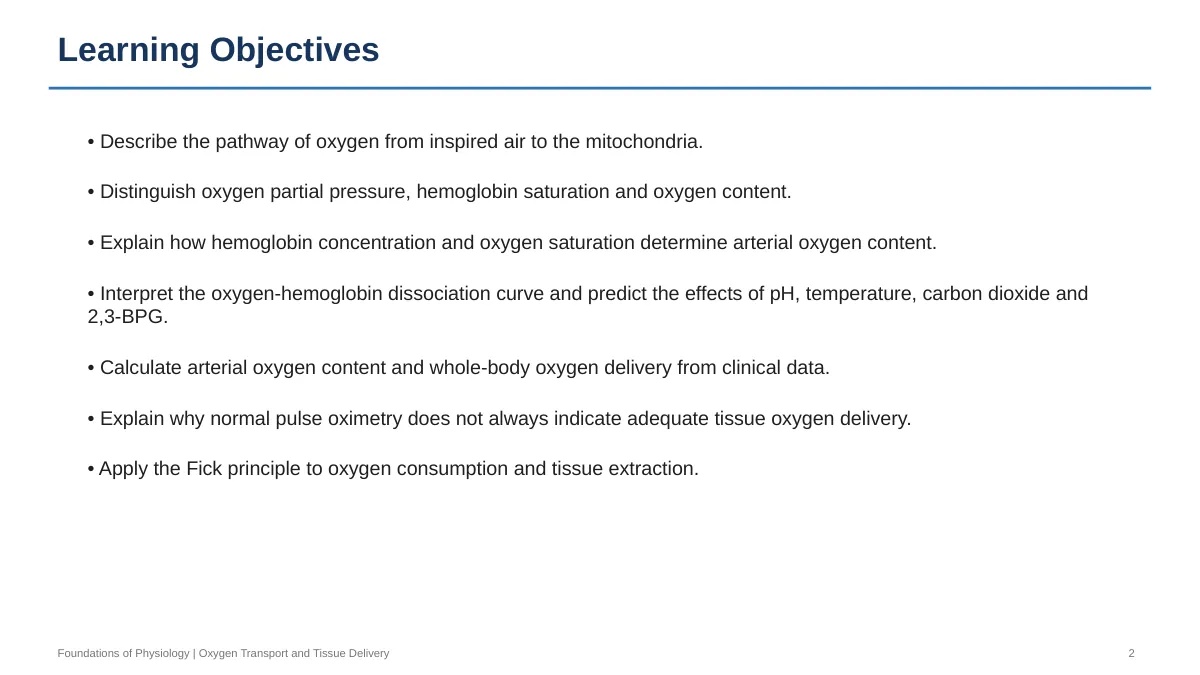
    Fifteen slides on oxygen transport and tissue delivery: the oxygen pathway, three numbers that are not the same number, the dissociation curve, the content and delivery equations, and the Fick principle. Slides 1, 2 and 15 are the title, objectives and references.

    Output 1 of 3

    The Story, in full

    The understanding layer. It explains why each conclusion follows from the mechanism, embeds the slide it is talking about, and works the professor's own vignettes. This is the complete text, with the generated title.

    Generated title

    The Number That Lies

    Four Handoffs Between Air and Mitochondria

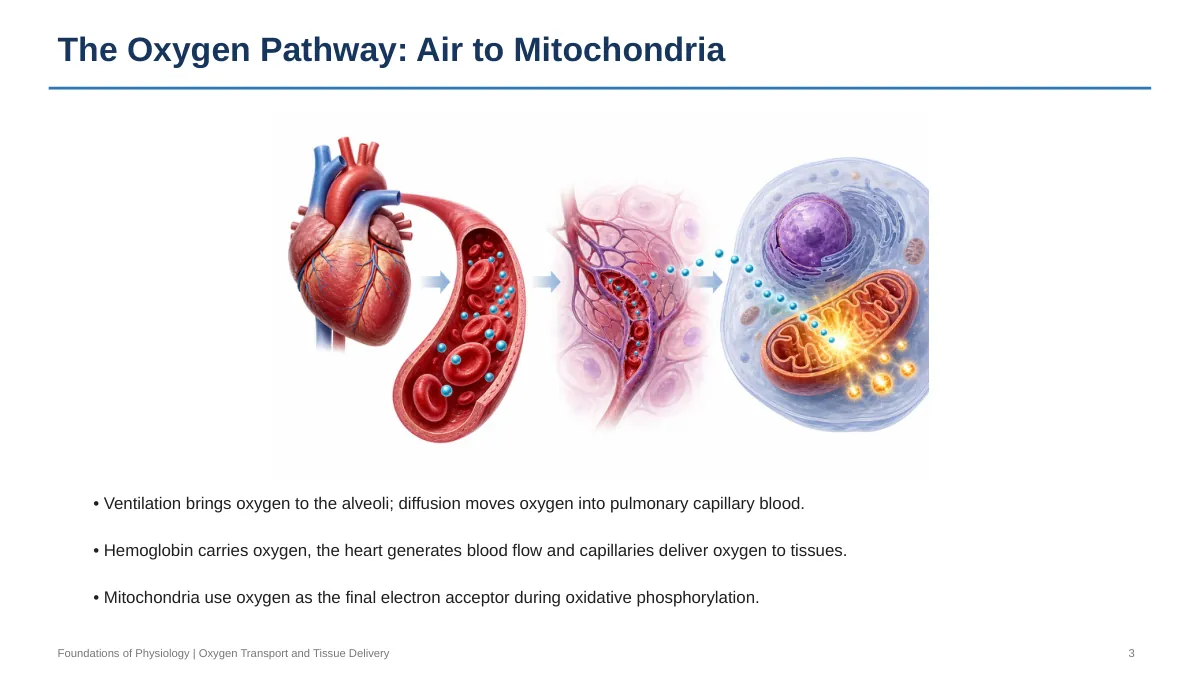
    Oxygen has to travel a long way to do its one job. That job happens at the end of the electron transport chain, where mitochondria use oxygen as the final electron acceptor. If oxygen doesn't arrive, oxidative phosphorylation stalls and ATP production collapses.

    Getting there takes four separate steps, and each one can fail on its own. Ventilation moves air into the alveoli. Diffusion moves oxygen across the alveolar wall into pulmonary capillary blood. Hemoglobin binds it and carries it. The heart pumps that blood, and capillaries hand oxygen off to the tissue.
    Alveolar air
    ↓ ventilation raises alveolar PO2
    Alveolar gas
    ↓ diffusion down a pressure gradient
    Pulmonary capillary blood
    ↓ hemoglobin binds oxygen
    Arterial blood
    ↓ cardiac output moves blood
    Tissue capillary
    ↓ unloading and diffusion
    Mitochondria
    Lecture slide 3
    Slide 3Notice that carrying and pumping are separate links — a failure at either one starves the mitochondria even with perfect lungs.

    Hold onto that: loaded, carried, pumped, extracted. Everything in this lecture is a failure of one of those four.

    Three Numbers That Are Not the Same Number

    Students collapse "oxygen in the blood" into one idea. It's actually three, and they can move independently.

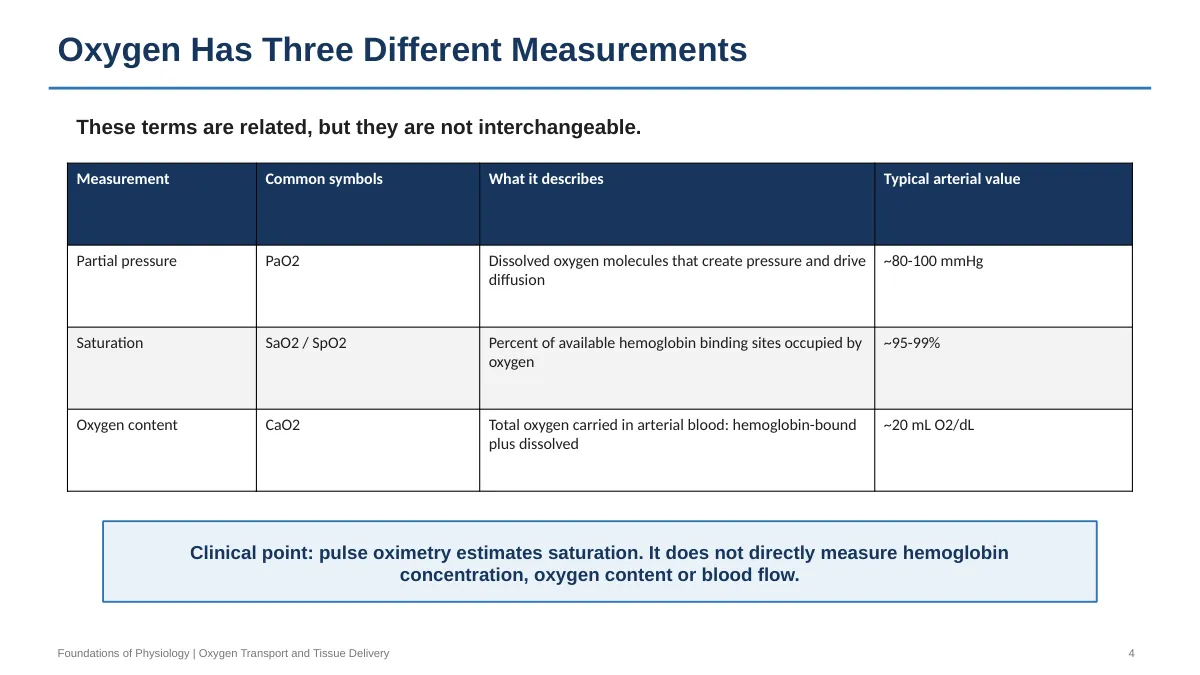
    Partial pressure (PaO2) measures only the oxygen physically dissolved in plasma, normally about 80–100 mmHg. Dissolved molecules create pressure, and pressure is what drives diffusion. So PaO2 tells you about the gradient, not the cargo.

    Saturation (SaO2, or SpO2 by pulse oximeter) is the percent of available hemoglobin binding sites that are occupied, normally 95–99%. It's a percentage — of whatever hemoglobin happens to be there.

    Content (CaO2) is the total oxygen actually carried per deciliter of arterial blood, hemoglobin-bound plus dissolved, normally about 20 mL O2/dL. This is the one the tissues care about.
    Lecture slide 4
    Slide 4Read the third column: pressure drives diffusion, saturation is a percentage of sites, content is the actual amount carried.

    The clinical consequence is already visible. A pulse oximeter estimates saturation. It does not measure hemoglobin concentration, oxygen content, or blood flow.

    Why the Curve Is S-Shaped, and Why That Shape Is Useful

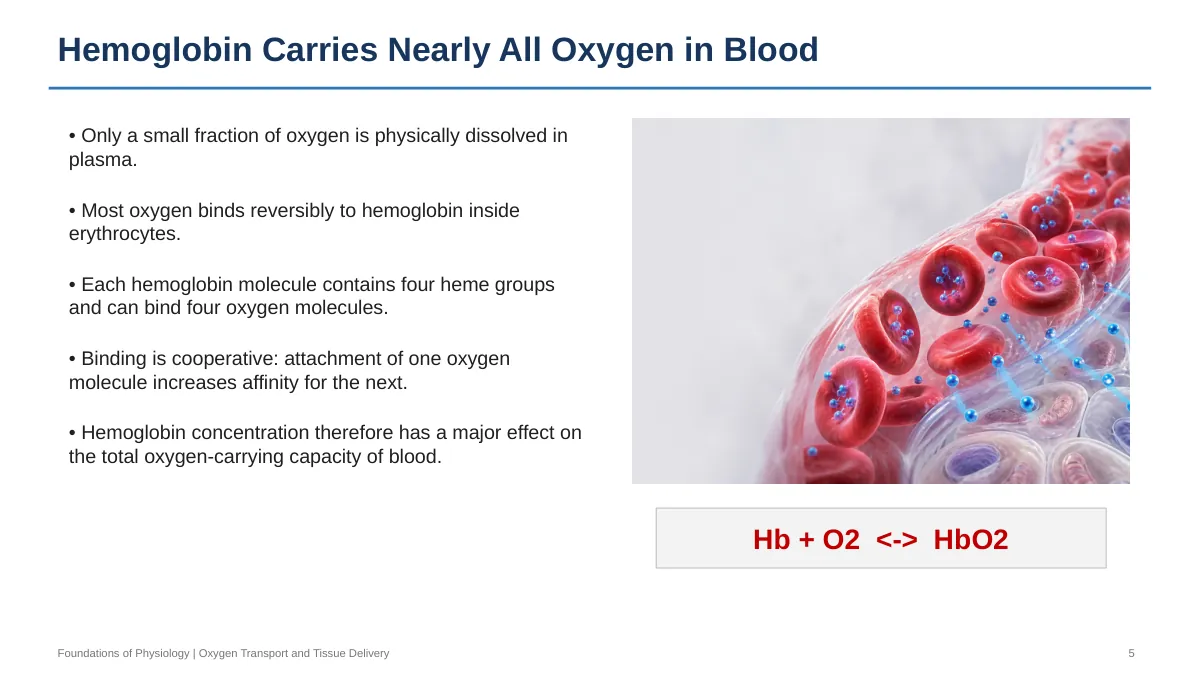
    Only a small fraction of oxygen dissolves in plasma; nearly all of it binds reversibly to hemoglobin inside red cells. Each hemoglobin molecule has four heme groups, so it binds up to four oxygen molecules.

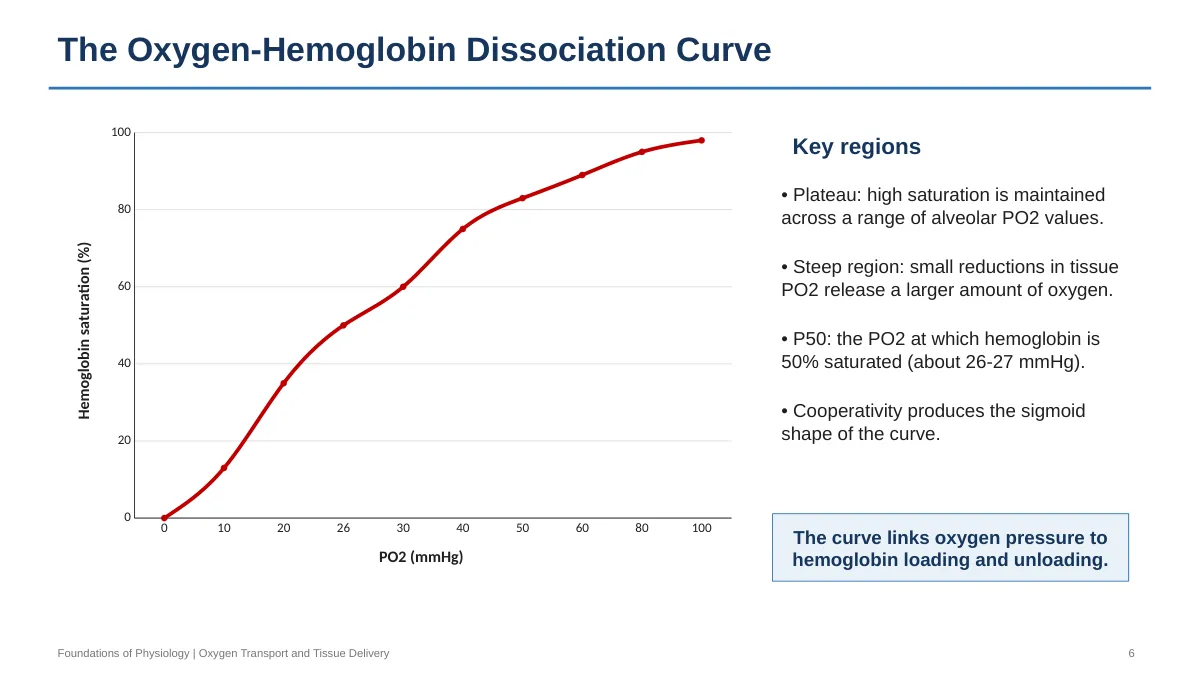
    Binding is cooperative: when one oxygen attaches, the molecule's affinity for the next one rises. That single fact produces the sigmoid curve. Early binding is slow, then it accelerates, then it saturates.
    Lecture slide 6
    Slide 6Trace the plateau above ~60 mmHg versus the steep slope below it — same molecule, two different jobs.

    The two regions do two different jobs. On the plateau, saturation stays high across a wide range of alveolar PO2, so lung loading is protected against modest drops in alveolar oxygen. On the steep region, a small fall in tissue PO2 releases a large amount of oxygen — which is exactly what a working tissue needs. P50, the PO2 at 50% saturation, is about 26–27 mmHg and is how we label the curve's position.

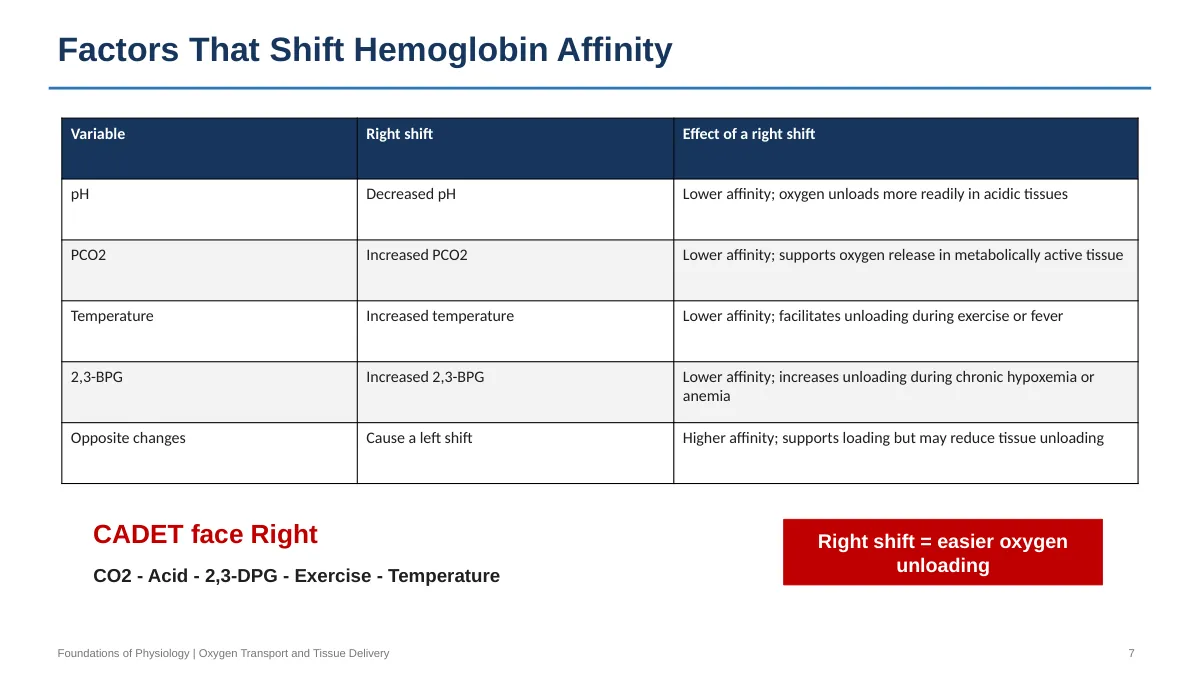
    Shift the curve right and affinity falls, so oxygen unloads more readily at the tissue. Four things do this, and the professor's cue is CADET, face Right: CO2, Acid (low pH), 2,3-DPG, Exercise, Temperature. Notice these are all the local signature of a tissue that's burning fuel — rising CO2, rising acid, rising heat. The tissue announces its need and hemoglobin answers. Raised 2,3-BPG works over a longer timescale, increasing unloading in chronic hypoxemia or anemia. Opposite changes shift left: better loading, but stingier unloading.
    Lecture slide 7
    Slide 7The right-shift column shares one theme — every trigger is a marker of active metabolism.

    The Equation That Exposes the Lie

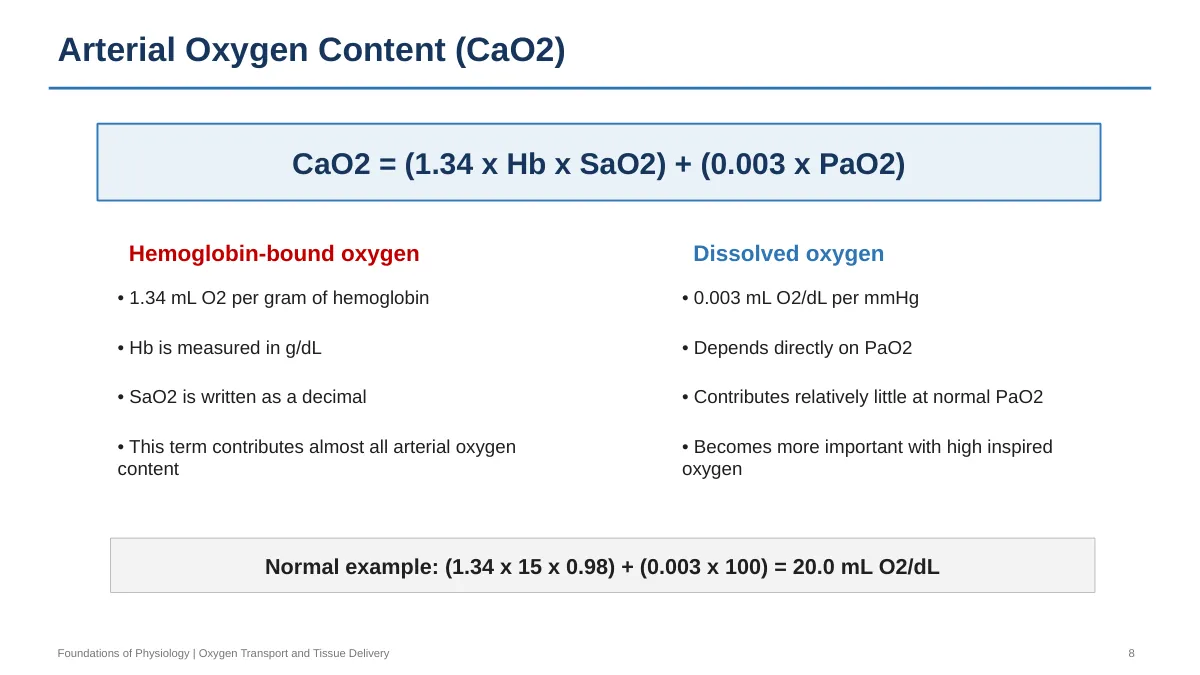
    Now quantify content. Arterial oxygen content is the sum of the bound and the dissolved:

    CaO2 = (1.34 × Hb × SaO2) + (0.003 × PaO2)

    Each gram of hemoglobin carries 1.34 mL of oxygen when fully saturated, with Hb in g/dL and SaO2 written as a decimal. Dissolved oxygen adds only 0.003 mL/dL per mmHg — trivial at normal PaO2, though it grows in importance with high inspired oxygen. A normal patient: (1.34 × 15 × 0.98) + (0.003 × 100) = 20.0 mL O2/dL.
    Lecture slide 8
    Slide 8Compare the size of the two terms — the hemoglobin term supplies essentially all of the content.

    Look at the structure. Hemoglobin sits inside the dominant term, but nowhere in a saturation reading. So saturation can be perfect while content is halved.
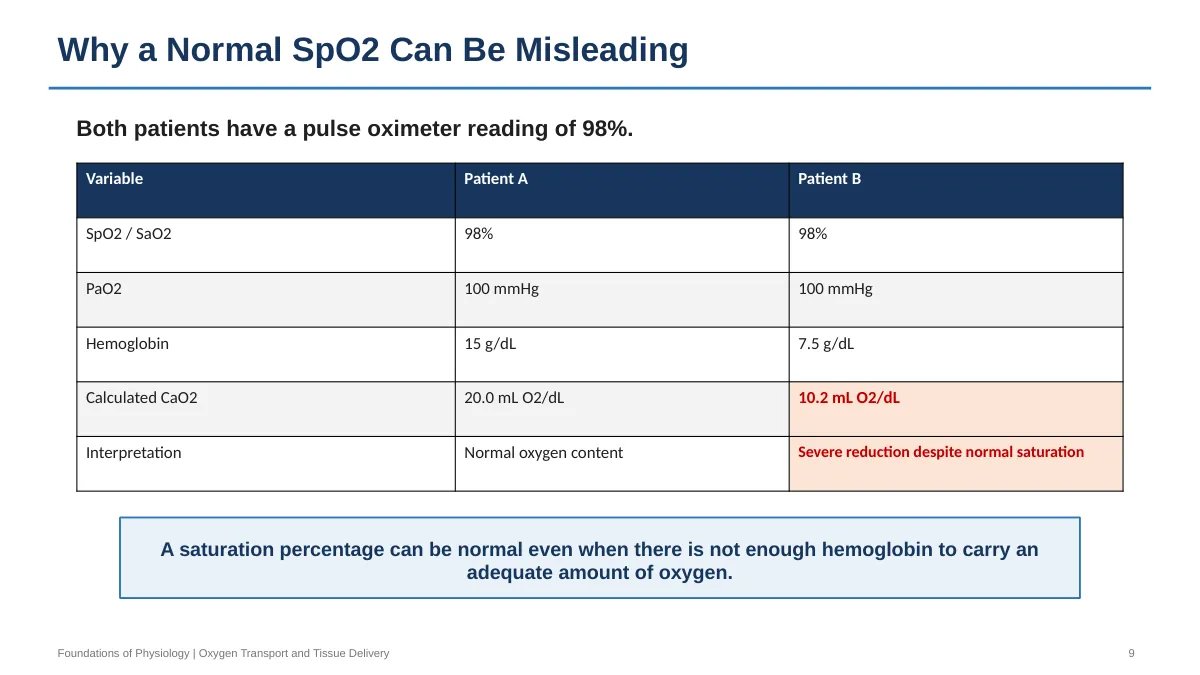
    Lecture slide 9
    Slide 9Same SpO2, same PaO2, half the hemoglobin — and half the oxygen content.

    Patient A and Patient B both read 98% with a PaO2 of 100 mmHg. A has Hb 15 g/dL and CaO2 of 20.0 mL O2/dL. B has Hb 7.5 g/dL and CaO2 of 10.2 mL O2/dL. The oximeter says they're identical. They are not. That's why a normal SpO2 never excludes inadequate oxygen content.

    Delivery Is a Product, So Either Factor Can Break It

    Content is oxygen per deciliter. Tissues need oxygen per minute, so you multiply content by flow:

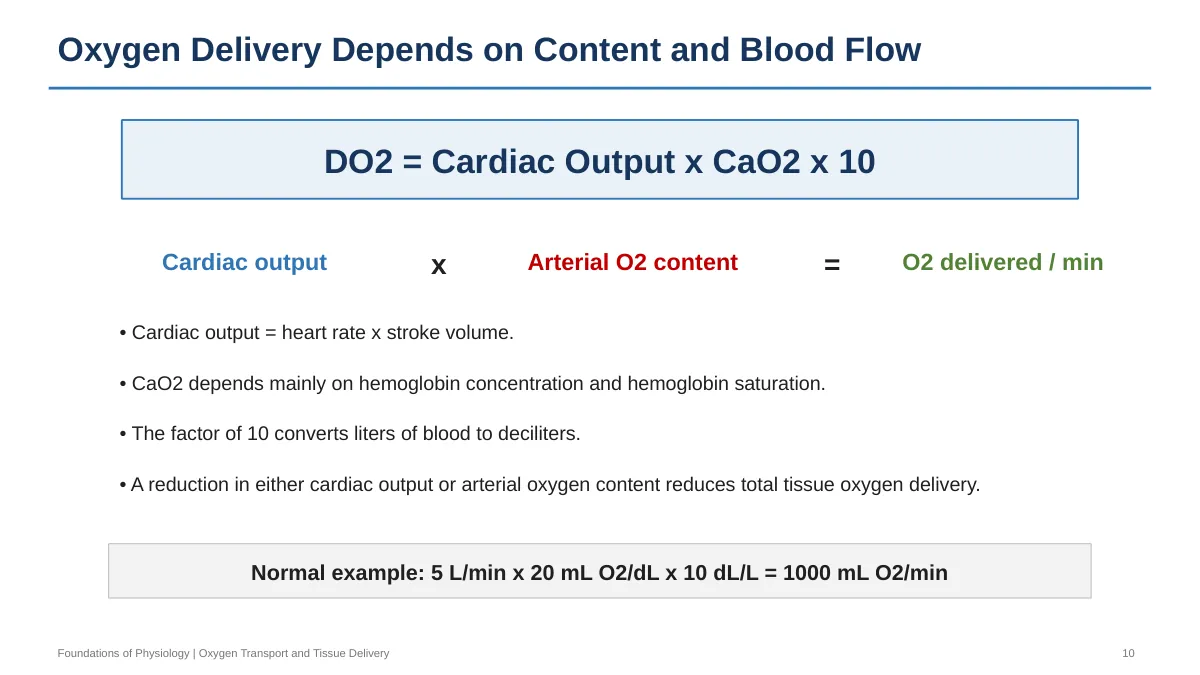
    DO2 = Cardiac Output × CaO2 × 10

    Cardiac output is heart rate times stroke volume, and the ×10 converts liters to deciliters. Normal: 5 L/min × 20 mL O2/dL × 10 = 1000 mL O2/min.

    Because delivery is a product, dropping either factor drops the whole thing. Halving hemoglobin to 7.5 g/dL at a normal cardiac output gives roughly 510 mL O2/min. Halving cardiac output to 2.5 L/min with normal hemoglobin gives roughly 500 mL O2/min. Two completely different diseases, nearly the same delivery — and a normal SpO2 in both.
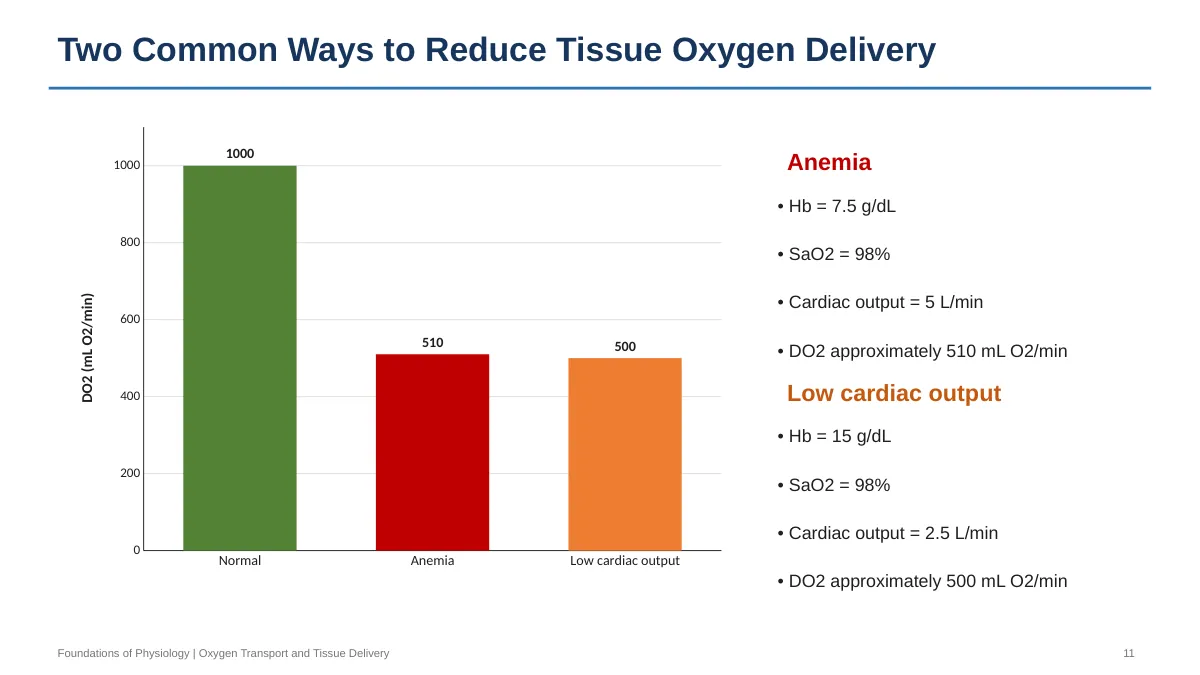
    Lecture slide 11
    Slide 11Anemia and low cardiac output arrive at the same DO2 by dropping different factors of the same product.

    This also explains why supplemental oxygen can't rescue anemia. Oxygen raises PaO2, which only touches the 0.003 term. With no hemoglobin to fill, there's almost nothing to gain.

    The Reserve That Buys Time

    Delivery isn't consumption. The Fick principle measures what the tissues actually take:

    VO2 = Cardiac Output × (CaO2 − CvO2) × 10

    The arterial–venous difference is the oxygen removed per deciliter of blood passing through. At rest: 5 L/min × (20 − 15) × 10 = 250 mL O2/min.

    Compare that to 1000 mL/min delivered. Resting tissues extract only about 25% of what arrives, leaving 75% as reserve. That reserve is the reason a patient can lose half their hemoglobin and still walk into clinic. When delivery falls, tissues first compensate by extracting a larger fraction — venous oxygen content drops, and the A–V difference widens.
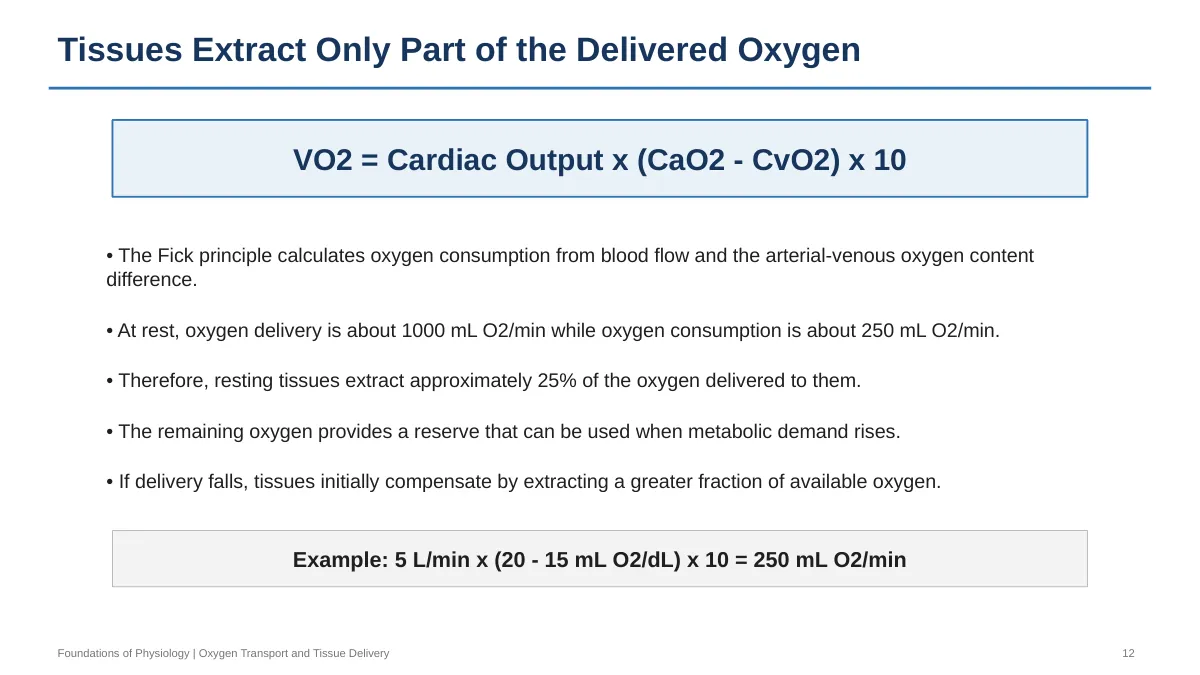
    Lecture slide 12
    Slide 12The gap between 1000 delivered and 250 consumed is the extraction reserve.

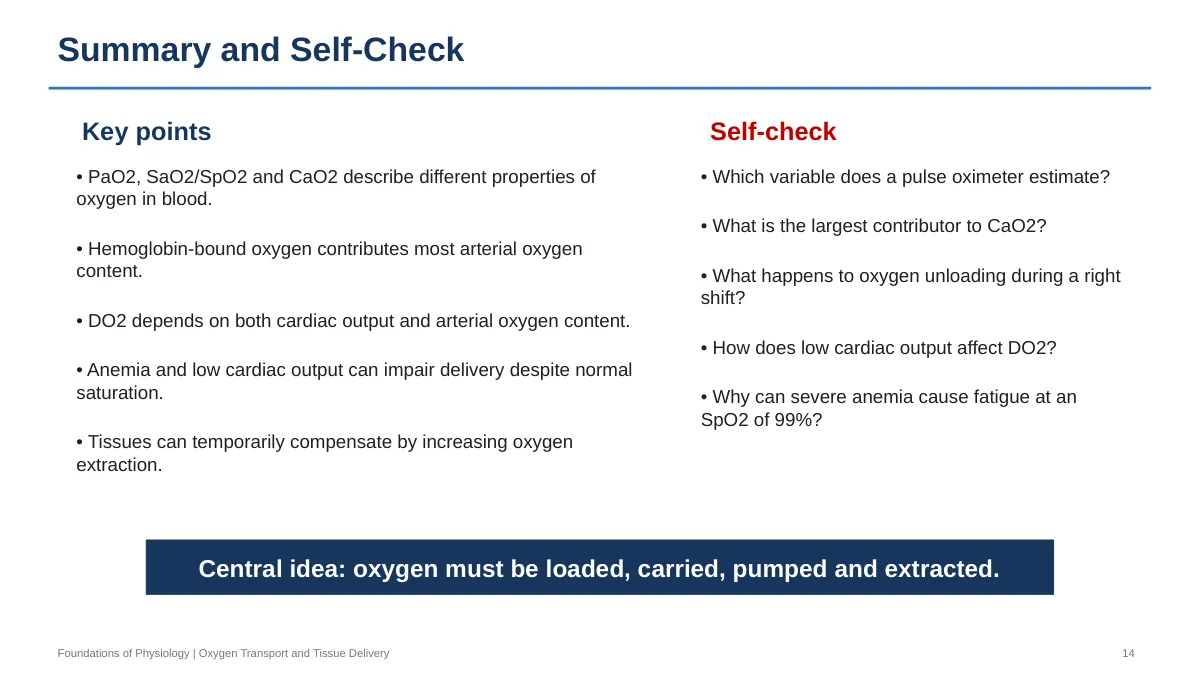
    Tachycardia is the other compensation: raising heart rate raises cardiac output, which raises DO2 directly.

    Cheat sheet

    • PaO2 vs SaO2 vs CaO2: pressure drives diffusion, saturation is percent of sites filled, content is the amount actually carried — only content feeds tissue.
    • A pulse oximeter reads saturation only — it never sees hemoglobin, content, or flow, so 99% can coexist with severe oxygen starvation.
    • Cooperativity → sigmoid curve: plateau protects lung loading across varying alveolar PO2; steep limb dumps large oxygen loads for small tissue PO2 drops.
    • P50 ≈ 26–27 mmHg labels curve position; higher P50 means lower affinity means easier unloading.
    • CADET, face Right: CO2, Acid, 2,3-DPG, Exercise, Temperature — all markers of active metabolism, so the tissue that works hardest gets the most oxygen released.
    • CaO2 = (1.34 × Hb × SaO2) + (0.003 × PaO2) — the hemoglobin term is essentially all of it; dissolved oxygen only matters at high inspired oxygen.
    • Halve the hemoglobin, halve the content at unchanged SpO2 — 15 g/dL gives 20 mL/dL, 7.5 g/dL gives 10.2 mL/dL.
    • DO2 = CO × CaO2 × 10 ≈ 1000 mL O2/min normally; because it's a product, anemia and low cardiac output cause near-identical delivery failure.
    • Supplemental oxygen can't fix anemia — it only inflates the 0.003 × PaO2 term when the carrier itself is missing.
    • Fick: VO2 = CO × (CaO2 − CvO2) × 10 ≈ 250 mL/min at rest, so resting extraction is only ~25%.
    • Falling delivery → widened A–V difference first, then tachycardia raises cardiac output; the 75% reserve is why decompensation is late and sudden.
    • Central chain to reconstruct everything: oxygen must be loaded, carried, pumped, and extracted — name the broken link and the management follows.

    Output 2 of 3

    All 30 Anki cards

    In the order the deck has them. Open the back to see the answer, the "why it matters" note, and the slide the card was built from, which is also what sits on the back of the card inside Anki. The deck is the download at the top of the page.

    Card 1Causal chainSlide 3

    Trace the pathway of oxygen from inspired air to the mitochondria.

    Show the back
    1. 1.Ventilation delivers O2 to the alveoli
    2. 2.Diffusion across the alveolar-capillary membrane into pulmonary capillary blood
    3. 3.Binding to hemoglobin in erythrocytes
    4. 4.Cardiac output carries blood to tissue capillaries
    5. 5.Diffusion into cells; mitochondria use O2 as the final electron acceptor in oxidative phosphorylation

    Why it mattersEach step is a separate place the chain can break, which is why saturation alone never proves the whole pathway is intact.

    Source slide 3Slide 3, on the back of the card
    Card 2BasicSlide 3

    What is the role of oxygen at the end of the oxygen pathway, inside the mitochondria?

    Show the back

    Final electron acceptor during oxidative phosphorylation

    Why it mattersThis is the endpoint that makes delivery failure matter: without the terminal acceptor, ATP production shifts to anaerobic metabolism.

    Source slide 3Slide 3, on the back of the card
    Card 3BasicSlide 4

    Distinguish PaO2, SaO2 and CaO2 by what each one actually describes.

    Show the back

    PaO2: pressure created by dissolved O2 molecules; drives diffusion SaO2: percent of available hemoglobin binding sites occupied by O2 CaO2: total O2 carried in arterial blood (hemoglobin-bound plus dissolved)

    Why it mattersNearly every trap in this lecture depends on treating one of these as a proxy for another.

    Source slide 4Slide 4, on the back of the card
    Card 4BasicSlide 4

    Give the typical arterial values for PaO2, SaO2 and CaO2.

    Show the back

    PaO2: ~80-100 mmHg SaO2: ~95-99% CaO2: ~20 mL O2/dL

    Why it mattersWithout the normal CaO2 of ~20 mL O2/dL, a calculated value of 10 means nothing on an exam question.

    Source slide 4Slide 4, on the back of the card
    Card 5BasicSlide 4

    Which single variable does pulse oximetry estimate, and which three things does it NOT directly measure?

    Show the back

    Estimates: saturation (SpO2) Does not measure: hemoglobin concentration, oxygen content, blood flow

    Why it mattersThe professor built an entire slide and a clinical vignette around this gap, so the omissions matter more than the reading itself.

    Source slide 4Slide 4, on the back of the card
    Card 6BasicSlide 5

    In blood, how is most oxygen carried, and how is the remainder carried?

    Show the back

    Most: bound reversibly to hemoglobin inside erythrocytes Remainder: a small fraction physically dissolved in plasma

    Why it mattersThis ratio is why hemoglobin concentration dominates the CaO2 equation and why raising PaO2 alone adds little content.

    Source slide 5Slide 5, on the back of the card
    Card 7BasicSlide 5

    How many heme groups does one hemoglobin molecule contain, and how many O2 molecules can it bind?

    Show the back

    Four heme groups; binds four O2 molecules

    Why it mattersFour binding sites is the structural precondition for cooperativity and therefore for the sigmoid curve.

    Source slide 5Slide 5, on the back of the card
    Card 8BasicSlide 5

    What does cooperative binding mean for hemoglobin's affinity as successive O2 molecules bind?

    Show the back

    Attachment of one O2 molecule increases affinity for the next

    Why it mattersCooperativity is the mechanism; the sigmoid curve is the observation, so knowing the direction lets you derive the shape rather than memorize it.

    Source slide 5Slide 5, on the back of the card
    Card 9BasicSlide 6

    What property of hemoglobin produces the sigmoid shape of the oxygen-hemoglobin dissociation curve?

    Show the back

    Cooperativity of oxygen binding

    Why it mattersA common exam move is to give a non-cooperative carrier such as myoglobin and ask why its curve is hyperbolic instead.

    Source slide 6Slide 6, on the back of the card
    Card 10BasicSlide 6

    On the oxygen-hemoglobin dissociation curve, what is the functional significance of the plateau versus the steep region?

    Show the back

    Plateau: high saturation maintained across a range of alveolar PO2 values (loading is protected) Steep region: small reductions in tissue PO2 release a large amount of O2 (unloading)

    Why it mattersThe plateau explains why SaO2 stays near-normal until PaO2 falls substantially, which is exactly why saturation is an insensitive early warning.

    Source slide 6Slide 6, on the back of the card
    Card 11BasicSlide 6

    Define P50 and give its normal value.

    Show the back

    The PO2 at which hemoglobin is 50% saturated; about 26-27 mmHg

    Why it mattersShifts are usually reported as a changed P50, so a rising P50 must immediately read as lower affinity to you.

    Source slide 6Slide 6, on the back of the card
    Card 12BasicSlide 7

    A right shift of the oxygen-hemoglobin dissociation curve indicates what change in hemoglobin affinity, and what change in oxygen unloading?

    Show the back

    Lower affinity for O2 Easier oxygen unloading to tissues

    Why it mattersEvery shift factor becomes derivable once this single translation is automatic, so memorizing five separate outcomes is unnecessary.

    Source slide 7Slide 7, on the back of the card

    Output 3 of 3

    All 13 practice questions

    Generated title: "Normal Saturation, Starving Tissues". Each has five options, an explanation that names the answer first, a note on every wrong option, and the slide it came from. The first three are open; try the rest before revealing.

    Question 1Slide 3

    A 24-year-old man is being evaluated after a stab wound to the thigh. His vital signs and laboratory data are used to reason through the sequence by which inspired oxygen reaches the site of aerobic ATP production. Which of the following correctly orders the major steps that oxygen must complete after reaching the alveolus?

    1. Alveolar diffusion → hemoglobin binding → convective transport by cardiac output → capillary diffusion → mitochondrial electron acceptance
    2. Hemoglobin binding → alveolar diffusion → capillary diffusion → convective transport by cardiac output → mitochondrial electron acceptance
    3. Alveolar diffusion → convective transport by cardiac output → hemoglobin binding → mitochondrial electron acceptance → capillary diffusion
    4. Capillary diffusion → hemoglobin binding → alveolar diffusion → convective transport by cardiac output → mitochondrial electron acceptance
    5. Alveolar diffusion → capillary diffusion → hemoglobin binding → convective transport by cardiac output → mitochondrial electron acceptance

    The answer is A: alveolar diffusion → hemoglobin binding → convective transport → capillary diffusion → mitochondrial use. Ventilation delivers oxygen to the alveolus, oxygen diffuses down its partial-pressure gradient into pulmonary capillary blood, and it then binds hemoglobin inside erythrocytes. The heart provides the convective step that moves oxygenated blood to the periphery, where oxygen diffuses across systemic capillaries into cells and serves as the final electron acceptor in oxidative phosphorylation. Choice E is tempting because it also begins with alveolar diffusion, but it places systemic capillary diffusion before hemoglobin loading and before the heart moves the blood, which is out of order. This matches the oxygen pathway on slide 3.

    • BHemoglobin cannot bind oxygen before oxygen has diffused from the alveolus into pulmonary capillary blood.
    • CHemoglobin loading occurs in the lung before convective transport, and mitochondrial use cannot precede capillary diffusion.
    • DSystemic capillary diffusion is the final delivery step, not the first event after inspired air reaches the alveolus.
    • EThis inverts the loading sequence by placing tissue capillary diffusion and hemoglobin binding before cardiac transport.
    Source slide 3Slide 3, beside the explanation
    Question 2Slide 4Flagged high-yield

    A student is asked to explain what a blood gas value of PaO2 95 mmHg actually represents in a patient with a hemoglobin of 6 g/dL. Which of the following statements best describes the physiologic quantity that PaO2 measures?

    1. The percentage of hemoglobin binding sites currently occupied by oxygen
    2. The total quantity of oxygen carried in each deciliter of arterial blood
    3. The pressure exerted by oxygen molecules dissolved in plasma, which drives diffusion
    4. The quantity of oxygen delivered to the tissues each minute by the circulation
    5. The fraction of delivered oxygen that peripheral tissues extract from capillary blood

    The answer is C: PaO2 is the pressure generated by oxygen molecules physically dissolved in plasma, and this partial pressure is what drives diffusion into and out of blood. It is not a measure of how much oxygen is present in total. Choice A is the most tempting error because PaO2 and SaO2 move together along the dissociation curve, but saturation describes occupancy of hemoglobin binding sites rather than dissolved gas pressure. Choice B describes CaO2, which additionally requires hemoglobin concentration. In this anemic patient, PaO2 may be entirely normal while total oxygen content is severely reduced. Slide 4 explicitly warns that these three terms are related but not interchangeable.

    • AThat defines SaO2/SpO2, the percentage of occupied hemoglobin binding sites, not dissolved oxygen pressure.
    • BTotal arterial oxygen per deciliter is CaO2, which requires hemoglobin concentration and saturation, not partial pressure alone.
    • DOxygen delivered per minute is DO2, the product of cardiac output and arterial oxygen content.
    • EThe extraction fraction is derived from the arterial-venous content difference, a separate concept from partial pressure.
    Source slide 4Slide 4, beside the explanation
    Question 3Slide 6Flagged high-yield

    In a laboratory experiment, purified hemoglobin is exposed to stepwise increases in PO2 and the resulting saturation is plotted. The curve is sigmoid rather than linear, and the steepest portion lies between roughly 20 and 40 mmHg. Which property of the hemoglobin tetramer best accounts for this shape and its physiologic advantage?

    1. Binding of one oxygen molecule increases the affinity of the remaining heme sites, steepening oxygen release as tissue PO2 falls
    2. Each of the four heme groups binds oxygen independently, producing proportional saturation across all partial pressures
    3. Dissolved plasma oxygen saturates first, and hemoglobin only begins to bind once plasma capacity is exceeded
    4. Hemoglobin irreversibly binds oxygen at high PO2 and requires enzymatic cleavage for release at the tissue level
    5. Hemoglobin releases oxygen only when the intracellular 2,3-BPG concentration falls below a threshold value

    The answer is A: cooperativity. Oxygen binding to one heme group induces a conformational change that raises affinity at the remaining sites, generating the sigmoid curve. The plateau lets arterial saturation stay high despite fluctuating alveolar PO2, while the steep segment near tissue PO2 values means a small drop in PO2 unloads a comparatively large amount of oxygen. Choice B is the tempting incomplete answer: four independent binding sites would yield a hyperbolic, not sigmoid, relationship and would lose the steep unloading advantage. The P50 of approximately 26-27 mmHg sits within this steep region, as shown on slide 6.

    • BIndependent, non-interacting binding sites would generate a hyperbolic curve without the steep tissue-unloading segment.
    • CDissolved oxygen and hemoglobin binding occur simultaneously; plasma does not saturate first in a sequential fashion.
    • DOxygen binding to hemoglobin is reversible and non-enzymatic, as expressed by Hb + O2 ↔ HbO2.
    • E2,3-BPG modulates affinity but is not a threshold switch required for any unloading to occur.
    Source slide 6Slide 6, beside the explanation
    Question 4Slide 7Flagged high-yield

    A 27-year-old man is running a marathon on a hot day. In his quadriceps capillary beds, muscle temperature is 39.5°C, local PCO2 is elevated, and lactate accumulation has lowered local pH. Which change in the oxygen-hemoglobin dissociation curve occurs in these capillaries, and what is its consequence?

    1. ARightward shift with a higher P50, increasing oxygen release to the exercising muscle
    2. BRightward shift with a lower P50, increasing oxygen release to the exercising muscle
    3. CLeftward shift with a lower P50, increasing oxygen release to the exercising muscle
    4. DLeftward shift with a higher P50, decreasing oxygen release to the exercising muscle
    5. ENo shift, with oxygen release increasing solely because of the higher cardiac output
    Question 5Slide 8Flagged high-yield

    A 62-year-old woman has a hemoglobin of 10 g/dL, an SaO2 of 0.90, and a PaO2 of 60 mmHg. Using the arterial oxygen content equation taught in this lecture, which of the following is closest to her calculated CaO2?

    1. A8.2 mL O2/dL
    2. B10.4 mL O2/dL
    3. C12.2 mL O2/dL
    4. D13.4 mL O2/dL
    5. E20.0 mL O2/dL
    Question 6Slide 9Flagged high-yield

    Two patients in a physiology demonstration each have an SpO2 of 98% and a PaO2 of 100 mmHg. Patient A has a hemoglobin of 15 g/dL and Patient B has a hemoglobin of 7.5 g/dL. Which statement best explains why their arterial oxygen contents differ by nearly half despite identical oximetry?

    1. ASaturation reports the fraction of binding sites occupied, whereas content also depends on how many binding sites exist
    2. BSaturation is unreliable at any hemoglobin below 10 g/dL, so Patient B's reading is falsely elevated
    3. CThe dissolved oxygen term becomes proportionally larger in anemia and lowers total measured content
    4. DAnemia shifts the dissociation curve leftward, reducing the oxygen that hemoglobin can bind at a given PO2
    5. EReduced hemoglobin lowers PaO2 in the pulmonary capillary, which in turn lowers arterial content
    Question 7Slide 10

    A 58-year-old man with decompensated heart failure has a hemoglobin of 15 g/dL, an SaO2 of 98%, an arterial oxygen content of 20 mL O2/dL, and a cardiac output of 2.5 L/min. Which of the following best approximates his whole-body oxygen delivery?

    1. A250 mL O2/min
    2. B500 mL O2/min
    3. C750 mL O2/min
    4. D1000 mL O2/min
    5. E2000 mL O2/min
    Question 8Slide 11

    An instructor presents two patients with markedly reduced oxygen delivery of approximately 500 mL O2/min. Patient 1 has Hb 7.5 g/dL, SaO2 98%, and cardiac output 5 L/min. Patient 2 has Hb 15 g/dL, SaO2 98%, and cardiac output 2.5 L/min. Which principle does this comparison best illustrate?

    1. ADelivery is determined by the product of flow and content, so a proportional fall in either term impairs delivery equally
    2. BDelivery is determined chiefly by arterial saturation, with flow and hemoglobin acting only as modifiers
    3. CDelivery is preserved whenever arterial saturation remains above 95%, regardless of hemoglobin or flow
    4. DDelivery depends primarily on dissolved oxygen, which is why supplemental oxygen corrects both scenarios
    5. EDelivery falls only when arterial oxygen content and cardiac output are reduced simultaneously
    Question 9Slide 12Flagged high-yield

    A hemodynamically monitored patient has a cardiac output of 5 L/min, an arterial oxygen content of 20 mL O2/dL, and a mixed venous oxygen content of 15 mL O2/dL. Which of the following pairs correctly gives this patient's oxygen consumption and resting extraction ratio?

    1. A100 mL O2/min; approximately 10%
    2. B250 mL O2/min; approximately 25%
    3. C250 mL O2/min; approximately 75%
    4. D500 mL O2/min; approximately 50%
    5. E1000 mL O2/min; approximately 100%
    Question 10Slide 13

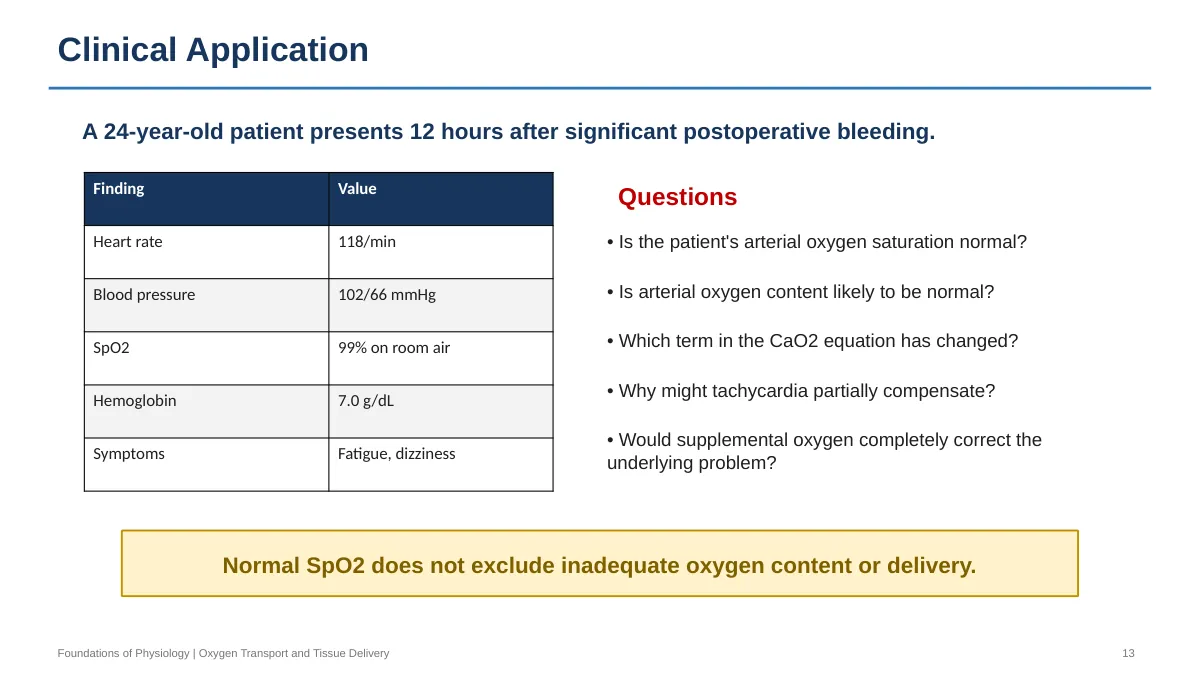
    A 24-year-old woman presents 12 hours after significant postoperative bleeding. Heart rate is 118/min, blood pressure is 102/66 mmHg, SpO2 is 99% on room air, and hemoglobin is 7.0 g/dL. She reports fatigue and dizziness. Which mechanism best explains how her tachycardia partially preserves tissue oxygen delivery?

    1. AIt increases cardiac output, offsetting the reduced arterial oxygen content in the delivery equation
    2. BIt raises arterial oxygen saturation toward 100%, compensating for the reduced hemoglobin mass
    3. CIt increases dissolved plasma oxygen by raising pulmonary capillary transit pressure
    4. DIt shifts the dissociation curve leftward, allowing hemoglobin to load more oxygen per gram
    5. EIt stimulates acute erythropoiesis, restoring hemoglobin-binding capacity within hours
    Question 11Slide 8

    The same postoperative patient with hemoglobin 7.0 g/dL and SpO2 99% on room air is placed on a nonrebreather mask, raising her PaO2 from 100 to 400 mmHg. Assuming saturation stays at 99%, approximately how much does her arterial oxygen content increase, and what does this imply?

    1. AApproximately 0.9 mL O2/dL, a minimal gain because the dissolved term contributes little relative to hemoglobin-bound oxygen
    2. BApproximately 4.0 mL O2/dL, a substantial gain because dissolved oxygen scales with the fourfold rise in PaO2
    3. CApproximately 9.0 mL O2/dL, restoring content to normal because supplemental oxygen replaces hemoglobin capacity
    4. DApproximately 0.9 mL O2/dL, a minimal gain because supplemental oxygen also lowers saturation through a right shift
    5. ENo measurable change, because dissolved oxygen does not contribute to arterial oxygen content at any PaO2
    Question 12Slide 12

    A patient in early cardiogenic shock has a cardiac output that has fallen from 5.0 to 3.0 L/min while arterial oxygen content remains 20 mL O2/dL. Whole-body oxygen consumption is unchanged at 250 mL O2/min. Which of the following mixed venous oxygen content values is most consistent with this state, and by what mechanism?

    1. A18.3 mL O2/dL, because reduced flow lengthens capillary transit and lowers extraction
    2. B20.0 mL O2/dL, because extraction is fixed and consumption is met entirely by dissolved oxygen
    3. C15.0 mL O2/dL, because the extraction ratio is fixed at 25% regardless of flow
    4. D11.7 mL O2/dL, because tissues extract a greater fraction of delivered oxygen to maintain consumption
    5. E5.0 mL O2/dL, because oxygen consumption must fall proportionally with delivery
    Question 13Slide 7

    A patient with chronic kidney disease and a hemoglobin of 8 g/dL has adapted over months to her anemia. Compared with a healthy control at the same PaO2, her erythrocyte 2,3-BPG concentration is elevated. What is the direct functional consequence for hemoglobin in her systemic capillaries?

    1. AIncreased oxygen affinity, so hemoglobin retains oxygen and venous oxygen content rises
    2. BDecreased oxygen affinity, so hemoglobin unloads more oxygen at any given tissue PO2
    3. CIncreased total oxygen-carrying capacity, so arterial oxygen content approaches normal
    4. DDecreased oxygen affinity in the lungs specifically, so arterial saturation falls markedly below 90%
    5. ENo change in affinity, since 2,3-BPG regulates erythrocyte glycolysis rather than hemoglobin binding

    What we would edit

    What came out wrong, or oddly

    We read all three outputs against the slides after the run. This is the list. It is the reason every card carries its slide and every page on this site says to check the output.

    • Card 29awkward

      The "why it matters" note opens with "Turkish grill house, the trap is reflexively reaching for oxygen." The generator addresses you by the name on your profile, and the test account this was run on is named after a restaurant. Set your name in Settings or clear it, or edit the card. It is left exactly as generated here.

    • Story, card 28, question 10inconsistent

      The same professor vignette (hemoglobin 7.0, SpO2 99%) is worked in all three outputs, and the arterial oxygen content comes out as 9.3, 9.6 and 9.5 mL/dL. The Story leaves out the dissolved term, the card includes it, the question rounds differently. None is wrong on the slide's own terms, but a student would want one number.

    • Question 1awkward

      A sequencing question ("order the steps oxygen takes") is dressed as a vignette about a stab wound to the thigh. The clinical wrapper does no work. The question underneath is sound.

    • Card 3, slide 4awkward

      Slide 4 is a three-row table (PaO2, SaO2, CaO2). It became a basic question-and-answer card with three lines on the back rather than a table card. Reviewable, but a table card would have graded each row separately.

    • Deck shapeawkward

      26 of the 30 cards are basic question-and-answer, one is a causal chain, three are practice vignettes. No comparison or table cards were produced for this lecture. Three cards each on slides 4, 7, 8 and 10 sit exactly at the density ceiling.

    • Card 30awkward

      The front starts with "Self-check:", copied from the heading of slide 14. Harmless, but it is slide furniture, not part of the question.

    • Question 7awkward

      The question is tied to slide 10 (the DO2 equation) but its explanation cites slide 11. Both slides support the answer; the citation is off by one.

    • Coveragegood

      Every learning objective on slide 2 has at least one card and one question. Slides 1, 2 and 15 (title, objectives, references) produced nothing, which is correct. We did not find a factually wrong card or question in this run.

    • Distractorsgood

      Every wrong option has a one-line reason, and the tempting ones are the errors a student actually makes: a right shift with a falling P50 (question 4), 1.34 × Hb without the saturation term (question 5), reporting the venous fraction instead of the extracted fraction (question 9).

    How to run this check on your own deck in ten minutes: checking AI-generated Anki cards. What each output is for and when to pick which: how it works.

    Your lecture next

    Generate this from a lecture you are actually being tested on.

    PDF or PowerPoint, up to 100 pages. New accounts start with five credits; all three outputs on one lecture is three. No credit card.